Every business process has a story steps that happen in order, decisions that branch into different paths, events that trigger action, and endpoints where work wraps up. BPMN notation symbols are the shared visual language that lets anyone from business analysts to developers to managers read and understand that story at a glance. Without them, process diagrams become guesswork. With them, teams communicate faster, build better workflows, and avoid expensive misunderstandings.
This guide breaks down what each BPMN symbol means, when to use it, and how to avoid the mistakes that trip up even experienced modelers. If you've ever stared at a diamond shape in a flowchart and wondered whether it means a decision, an event-based split, or something else entirely, this is for you.
What Does BPMN Stand For and Why Do People Use It?
BPMN stands for Business Process Model and Notation. It's a standardized graphical notation maintained by the Object Management Group (OMG). The current version, BPMN 2.0, was designed so that people across different roles in an organization can model, read, and discuss business processes using the same set of shapes and conventions.
Teams use BPMN notation because it fills a gap. Natural language descriptions of processes are vague. Flowcharts built in generic drawing tools lack standardized meaning. Code-based workflow definitions are precise but unreadable to non-technical stakeholders. BPMN gives you a middle ground visual enough for business users, precise enough for developers to automate from.
Common use cases include mapping current-state and future-state business processes, designing automation workflows, documenting compliance procedures, and communicating requirements between business and IT teams. You'll see BPMN in enterprise architecture, software development, operations management, and quality improvement projects.
What Are the Main Categories of BPMN Symbols?
BPMN symbols fall into five core categories. Understanding these categories first makes learning individual symbols much easier.
- Flow objects the main building blocks: events, activities, and gateways
- Connecting objects lines and arrows that link flow objects together: sequence flows, message flows, and associations
- Swimlanes containers that organize activities by role or department: pools and lanes
- Data objects symbols that represent information inputs and outputs: data objects, data stores, and data inputs/outputs
- Artifacts additional context like annotations and groups that don't affect process logic
Each category serves a distinct purpose, and mixing them up is one of the most frequent sources of confusion. A breakdown of event, gateway, and activity codes can help if you want to go deeper into the flow objects specifically.
What Do the Different Event Symbols Mean?
Events represent something that happens during a process a trigger, an outcome, or an interruption. They're drawn as circles, and their meaning changes based on border style and inner icon.
Start Events
A start event is a thin-bordered circle. It marks where a process instance begins. The icon inside tells you what triggers the process:
- None (empty circle) the process starts manually or is triggered externally
- Message envelope the process starts when a message is received
- Timer clock the process starts at a scheduled time or interval
- Lightning bolt the process starts from a signal or escalation
Intermediate Events
An intermediate event is a double-bordered circle that sits along a sequence flow or attached to the boundary of an activity. It represents something that happens between the start and end a delay, a message receipt, or a catch condition. When attached to an activity boundary, it can interrupt that activity or trigger a new path without stopping it (non-interrupting events use a dashed border).
End Events
An end event is a thick-bordered circle (bold or double-styled depending on the tool). It marks the completion of a process path. A plain end event means the path simply stops. A message end event means the process sends a message when it finishes. A terminate end event means all activity in the process halts immediately.
Throwing vs. Catching Events
This distinction confuses many beginners. A catching event waits for something to happen (like waiting for a message). A throwing event produces something (like sending a message). When an intermediate event has a filled icon, it's throwing. When it has an open icon, it's catching.
What Do Activity Symbols Represent?
Activities describe the work being done in a process. They're drawn as rounded rectangles.
- Task a single unit of work that can't be broken down further in the current model. Examples: "Review application," "Send invoice."
- Sub-process a compound activity that contains its own flow of events, activities, and gateways. Shown with a small plus sign (+) inside the rectangle. You can expand it to see detail or collapse it for a cleaner view.
Tasks also have task types indicated by small icons in the top-left corner:
- User task (person icon) performed by a human, often with a system interface
- Service task (gear icon) automated, typically calling a web service or API
- Script task (scroll icon) executed by a business rule engine or script
- Manual task (hand icon) performed by a person without system support
- Business rule task (table icon) evaluates a business rule
- Send/Receive task (envelope icon) sends or waits for a message
Knowing these task types matters because they directly affect how a process gets automated. A user task implies a human interface. A service task implies system integration. If you're mapping processes for software implementation, this example walkthrough for software developers shows how task types translate into actual code.
What Do Gateway Symbols Mean and When Do You Use Them?
Gateways control how a process flow diverges and converges. They're drawn as diamond shapes, and each type behaves differently.
- Exclusive gateway (X symbol or empty) only one outgoing path is taken based on a condition. Think of it as an "either/or" decision. This is the most common gateway and the one most people recognize as a decision point.
- Parallel gateway (+ symbol) all outgoing paths are taken simultaneously. Used when multiple tasks need to happen at the same time. A parallel merge waits for all incoming paths to complete before continuing.
- Inclusive gateway (O symbol) one or more outgoing paths can be taken based on conditions. More flexible than exclusive, less absolute than parallel. The merge waits for all active paths to complete.
- Event-based gateway (pentagon/pentagram icon) the next path depends on which event occurs first. For example, waiting for either a message response or a timer to expire.
- Complex gateway (asterisk) handles situations that don't fit the other patterns. Used rarely and should be documented clearly because its behavior isn't intuitive from the symbol alone.
A common mistake is using an exclusive gateway when an inclusive gateway is actually needed. If a customer order could trigger both a shipping process and a loyalty point update, an exclusive gateway would force you to choose one which is wrong. An inclusive gateway allows both paths.
How Do Connecting Objects Work in BPMN?
Connecting objects link flow objects to show the order and type of interaction.
- Sequence flow (solid line with arrow) shows the order in which activities are performed within a single process or pool. This is the default connection you'll use most often.
- Message flow (dashed line with open arrowhead) shows communication between separate pools (different participants or organizations). You cannot use message flow within a single pool.
- Association (dotted line) links artifacts like text annotations or data objects to flow objects. It shows a relationship without implying sequence or messaging.
The distinction between sequence flow and message flow is critical. Sequence flow means "this happens next." Message flow means "this participant sends information to that participant." Mixing them up creates diagrams that suggest impossible process behavior like a single department performing work that belongs to an external vendor.
What Are Pools and Lanes and How Do You Organize Them?
Swimlanes organize a process diagram by participant and responsibility.
- Pool represents a major participant, typically an organization, department, or external entity. Each pool contains its own process. A collaboration diagram with multiple pools shows how independent processes interact.
- Lane a sub-partition within a pool, representing a role, system, or sub-department. Lanes share the same process but clarify who does what.
For example, in an order fulfillment process, the pool might be "Retail Company." Inside, lanes could be "Sales Team," "Warehouse," and "Finance." Each lane holds the activities that role is responsible for, and sequence flows can cross lane boundaries freely.
A practical tip: don't create too many lanes. If you have more than five or six, consider splitting the process into separate diagrams or consolidating roles. Overcrowded swimlane diagrams become harder to read than no swimlanes at all.
What Do Data Objects and Artifacts Add to a BPMN Diagram?
Data objects (page-shaped icons) represent information that activities create, use, or update. They connect to activities via data associations and can show states for example, "Order Form" with the state "Submitted" vs. "Approved."
Data stores (cylinder or database icon) represent persistent data that exists beyond a single process instance, like a customer database or a document management system.
Text annotations are free-floating notes attached to flow objects via association lines. They add context that the symbols alone can't convey like explaining a business rule behind a gateway decision.
Groups (dashed rounded rectangles) visually cluster activities that share a characteristic without affecting the process logic. They're useful for highlighting phases or tagging activities that fall under a specific compliance requirement.
Data objects are optional in high-level process maps. But when you're designing for automation or documenting requirements, including them prevents ambiguity about what inputs and outputs each step needs.
What Are the Most Common Mistakes When Using BPMN Symbols?
Even with a standard notation, BPMN diagrams frequently contain errors that reduce their usefulness.
- Using decision diamonds for every branching point. Not every divergence is an exclusive decision. Parallel splits and event-based splits use different gateway types.
- Missing end events. Every path in a process should terminate at an end event. Orphaned flows that just stop with no endpoint create ambiguity about whether the process is complete or incomplete.
- Confusing message flow with sequence flow. If two different participants interact, use message flow between pools. Using sequence flow across pool boundaries implies a single process where there should be two.
- Overusing sub-processes. Sub-processes are helpful for managing complexity, but nesting too many layers makes diagrams frustrating to navigate. Three levels of depth is a reasonable limit for most audiences.
- Ignoring gateway merge behavior. A parallel split without a corresponding parallel merge can cause the process to behave unexpectedly continuing as soon as one branch finishes instead of waiting for all branches.
- Leaving gateway conditions ambiguous. Every outgoing sequence flow from an exclusive or inclusive gateway should have a clear label or condition expression. Unlabeled branches force readers to guess.
A practical exercise: take any existing process diagram you have and check each gateway. Ask, "Is this the right type of gateway, and does every outgoing path have a labeled condition?" You'll likely find at least one issue.
How Should Beginners Start Reading a BPMN Diagram?
If you're looking at a BPMN diagram for the first time, follow this approach:
- Find the start event. It's the thin-bordered circle. This is where the process begins.
- Follow the sequence flow. Trace the solid arrows from the start event through activities and gateways.
- Identify gateways and branches. Note the diamond shapes. Read the labels on each outgoing path to understand the decision logic.
- Look for pools and lanes. These tell you who is responsible for each section of work.
- Check for intermediate events. These indicate waits, triggers, or interruptions along the flow.
- Find the end events. Every complete path should end at a thick-bordered circle.
Having a quick-reference sheet beside you while reading diagrams speeds things up significantly. If you need one, this BPMN notation reference sheet covers every symbol in a compact format.
What Tips Help You Create Better BPMN Diagrams?
- Start with the happy path. Model the standard flow first what happens when everything goes right. Add exception paths and error handling afterward.
- Use consistent naming. Activities should start with a verb: "Approve request," "Validate data," "Generate report." This makes the process read like a set of instructions.
- Limit diagram complexity. If a single diagram has more than 15–20 activities, consider breaking it into sub-processes or linked diagrams.
- Label every gateway branch. Even if the condition seems obvious to you, it won't be obvious to the next person reading the diagram six months from now.
- Keep one direction of flow. Sequence flows should generally move left-to-right or top-to-bottom. Backward flows (loops) are acceptable but should be clearly marked.
- Validate with stakeholders. Walk through the diagram with the people who actually perform the process. Their feedback catches gaps that no notation review will find.
Quick Reference Checklist for BPMN Symbol Accuracy
Use this checklist before finalizing any BPMN diagram:
- ☐ Every process path has a clearly marked start event and at least one end event
- ☐ Gateways use the correct type (exclusive, parallel, inclusive, event-based) for the actual behavior
- ☐ All gateway branches have descriptive condition labels
- ☐ Parallel gateways have matching merge gateways downstream
- ☐ Message flows only connect separate pools, never flow within a single pool
- ☐ Activity names start with verbs and describe specific work
- ☐ Task types (user, service, script) are correctly identified with the right icons
- ☐ Sub-processes are used to manage complexity, not to hide it
- ☐ Data objects and annotations add meaningful context without clutter
- ☐ The diagram has been reviewed by at least one person who performs the process
Next step: Pick one real process in your organization something simple like employee onboarding or expense reporting and map it using BPMN symbols from this guide. Compare your diagram against the checklist above. You'll find that the act of modeling exposes gaps in process understanding that no amount of reading can substitute for.
 Bpmn Notation Reference Sheet for Enterprise Architecture Teams
 How to Read Bpmn Event Gateway and Activity Codes in Workflow Mapping
 Bpmn 2.0 Collaboration Diagram Best Practices for Business Analysts
 Bpmn Process Diagram Examples for Software Developers
 Flowchart Codes for Business Process Mapping: a Complete Guide
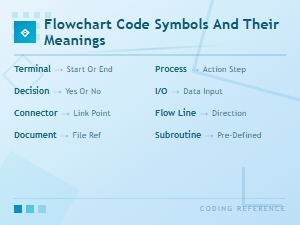 Flowchart Code Symbols and Their Meanings: a Complete Visual Guide