Designing a database without a visual plan is like building a house without blueprints. You might get something standing, but good luck making changes later. Flowchart codes for database architecture give you a visual language to map out how your database is structured tables, relationships, queries, and workflows before a single line of SQL gets written. They help teams spot problems early, communicate clearly across technical and non-technical roles, and build databases that actually hold up under real use.
What exactly are flowchart codes for database architecture?
Flowchart codes for database architecture are standardized symbols and notations used to represent the structure, logic, and flow of a database system in diagram form. Think of them as a shorthand. Instead of writing paragraphs explaining how users, orders, and products connect in your e-commerce database, you draw it out using specific shapes and connectors that anyone familiar with flowchart conventions can read.
These codes follow conventions similar to standard flowchart symbols and their meanings, but they're applied specifically to database contexts entity relationships, data flow paths, decision points for queries, and process triggers within a database management system.
Why would someone use flowchart codes instead of just writing the schema?
A raw database schema tells you what exists. Flowchart codes tell you how data moves, where decisions happen, and why certain structures exist. Here's when they become especially useful:
- Planning a new database from scratch you need to visualize entity relationships and data flow before committing to a schema.
- Documenting an existing system new team members can understand the architecture without digging through hundreds of lines of SQL.
- Debugging data bottlenecks a visual map makes it easier to trace where slow queries or broken relationships originate.
- Communicating with stakeholders product managers, business analysts, and non-technical team members can follow a flowchart far more easily than raw code.
Teams working under agile development methodologies often rely on these diagrams during sprint planning and retrospectives to keep everyone aligned on database design decisions.
What symbols do you actually use for database architecture flowcharts?
You don't need to memorize dozens of obscure shapes. Most database architecture flowcharts rely on a handful of core symbols:
- Rectangle represents a process or action (e.g., "Validate user input," "Execute query").
- Parallelogram represents input/output, typically data being read from or written to a table.
- Diamond a decision point (e.g., "Does the record exist?"). The flow splits based on yes/no outcomes.
- Cylinder (or disk shape) the standard symbol for a database or data store. This is your tables, schemas, or storage systems.
- Arrow/connector lines show the direction of data flow or process sequence.
- Document shape represents a report or output document generated from the database.
Some architects also use UML notation or Entity-Relationship Diagram (ERD) symbols alongside traditional flowchart shapes when the database design involves complex relationships between entities. The choice depends on your team's conventions and the complexity of the system you're mapping.
How do you map a real database architecture with flowchart codes?
Let's walk through a practical example. Say you're designing the database for an online bookstore. Here's how you'd use flowchart codes step by step:
- Start with the data stores. Draw cylinders for each major table: Users, Books, Orders, Payments, Inventory.
- Map the relationships. Use arrows to connect related tables. Users connect to Orders (one-to-many). Orders connect to Payments (one-to-one). Books connect to Inventory (one-to-one).
- Add process boxes. Between data stores, insert rectangles for actions: "Search catalog," "Add to cart," "Process payment," "Update inventory."
- Insert decision diamonds. At key points, add decisions: "Is the item in stock?" → Yes: proceed to checkout. No: redirect to out-of-stock page. "Payment approved?" → Yes: confirm order. No: retry or cancel.
- Show data inputs and outputs. Use parallelograms where user data enters the system (registration form, search query) and where data exits (order confirmation, shipping notification).
This kind of diagram works hand-in-hand with flowchart codes used for business process mapping, since database architecture rarely exists in isolation from the business processes it supports.
What are common mistakes people make with database flowcharts?
Even experienced architects fall into these traps:
- Overcomplicating the diagram. If your flowchart needs 40+ symbols on a single page, split it into sub-diagrams one per module or feature area. A payment processing flow should be separate from user management.
- Mixing abstraction levels. Don't put high-level business processes and low-level SQL operations on the same chart. Keep them consistent within each diagram.
- Skipping decision points. Real databases are full of conditional logic (what happens when a constraint fails, when a record doesn't exist, when a transaction rolls back). Ignoring these makes your diagram incomplete and misleading.
- Not updating the diagram. A flowchart that doesn't reflect the current database is worse than no flowchart at all. Build a habit of updating diagrams whenever the schema changes.
- Using inconsistent symbols. If a cylinder means "database" in one place and "external API" in another, your diagram creates confusion instead of clarity. Define your legend and stick to it.
What tools work well for creating these flowcharts?
You have plenty of options depending on your budget and needs:
- Draw.io (diagrams.net) Free, browser-based, integrates with Google Drive and GitHub. Has built-in database and flowchart shape libraries.
- Lucidchart Paid tool with strong collaboration features and templates specifically for database diagrams and ERDs.
- Microsoft Visio Industry standard in enterprise environments. Robust database modeling templates, but requires a license.
- Mermaid.js Text-based diagramming. You write code that renders into flowcharts, making it great for version-controlled documentation alongside your database migration files.
- dbdiagram.io Specifically built for database schema visualization. You write a simple DSL and it generates the diagram.
For teams that prefer diagrams-as-code workflows, Mermaid.js is worth exploring because it keeps your database architecture diagrams in the same repository as your source code.
What tips help you get more value from database flowcharts?
A few practices that make these diagrams genuinely useful rather than just busywork:
- Start with the data, not the process. Identify your core entities and their relationships first. Then layer on the processes and decision logic.
- Use color coding. Many teams assign colors to different categories blue for user-facing processes, orange for backend logic, red for error handling. This speeds up reading significantly.
- Include a legend. Every diagram should have a small key explaining what each symbol represents. What's obvious to you is not obvious to the next person reading it.
- Review with your whole team. Database architects, backend developers, and QA testers all see different things when they look at the same diagram. Get multiple perspectives before finalizing.
- Keep it living. Store your diagrams alongside your project documentation and treat them like code review changes, version them, and retire outdated ones.
What should you do next?
If you're planning a database project, here's a practical checklist to get started with flowchart codes:
- List all the main data entities your database will contain (tables, collections, etc.).
- Sketch the relationships between entities using lines and crow's foot notation or simple arrows.
- Identify the top 3–5 user or system workflows that interact with this database.
- Map each workflow using standard flowchart symbols process rectangles, decision diamonds, and data cylinders.
- Review the full diagram with at least one technical and one non-technical team member.
- Choose a tool (free or paid) and digitize your diagram for team access and version control.
- Set a reminder to revisit and update the diagram whenever the database schema changes.
Good database architecture starts with clear thinking, and clear thinking starts with good diagrams. Get the visual foundation right, and the actual implementation becomes significantly easier to build, debug, and scale.
 Flowchart Codes for Business Process Mapping: a Complete Guide
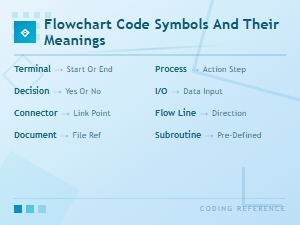 Flowchart Code Symbols and Their Meanings: a Complete Visual Guide
 Agile Flowchart Coding Standards for Efficient Team Collaboration
 How Flowchart Codes Work in Software Engineering Explained
 Bpmn Notation Reference Sheet for Enterprise Architecture Teams
 How to Read Bpmn Event Gateway and Activity Codes in Workflow Mapping